Getting Started
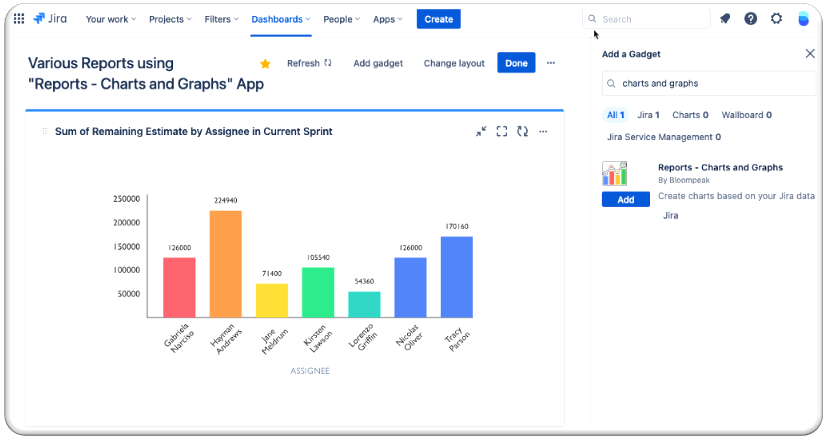
Using Reports - Charts and Graphs for Jira app you can generate simple yet robust charts, graphs and reports to summarize and visualize your data on your Jira dashboards.
After installation, a new dashboard gadget will be introduced into Jira. Just add the new gadget to your dashboard and start building your charts, graphs and reports.
App Usage
By visualizing your data, you can get valuable insights on how your business is performing, understand your success and improvement areas and identify bottlenecks(if any) in your product life cycle. This app helps you visualize your data by providing a high flexibility for generating the charts, graphs and reports you need. You can create custom and colorful bar charts and table views for any data you want to summarize or visualize.
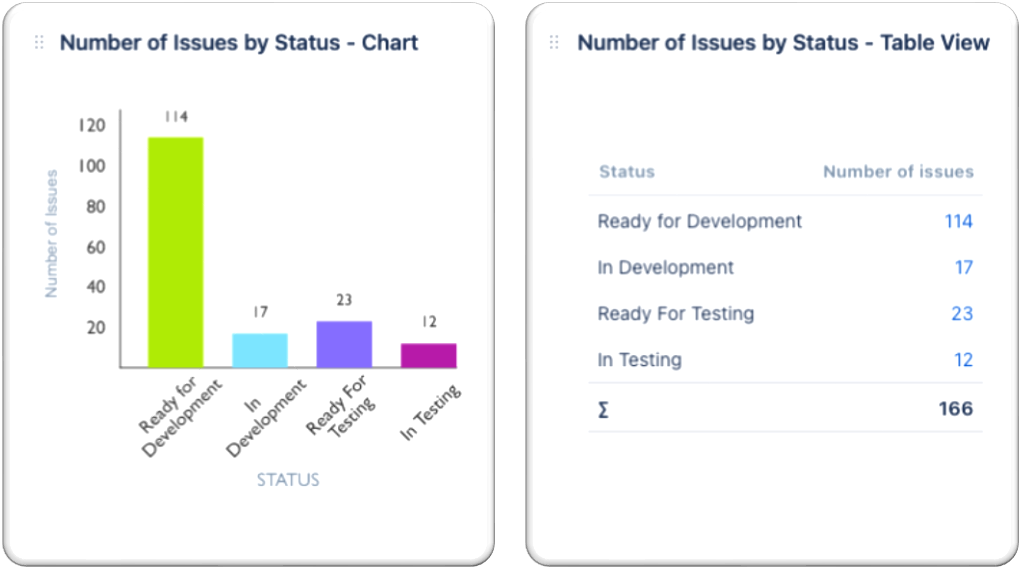
Custom, Flexible, Colorful Charts and Table Views
There is no need for coding. You can create custom, flexible and colorful bar charts and table views by just simply adding “Reports - Charts and Graphs” gadget to your dashboard and choosing the parameters and setting the fields.
You can create reports for any data you need and whenever you open your dashboards, your reports will welcome you with up-to-date data.
Here is our live demo dashboard where you can see and modify sample reports, add new ones and play with them.
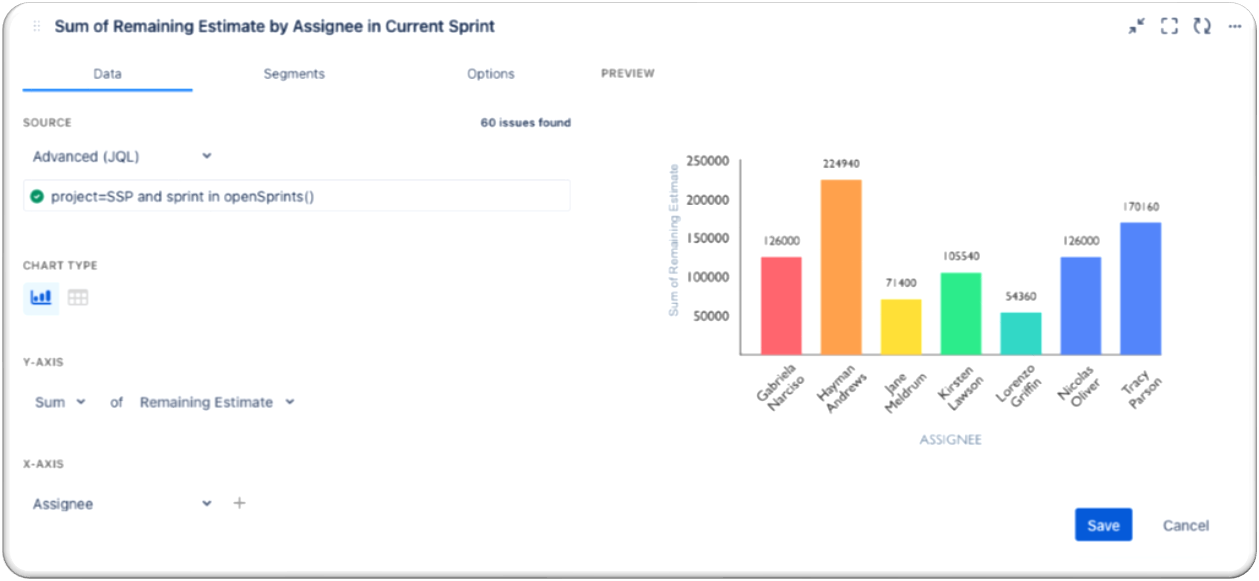
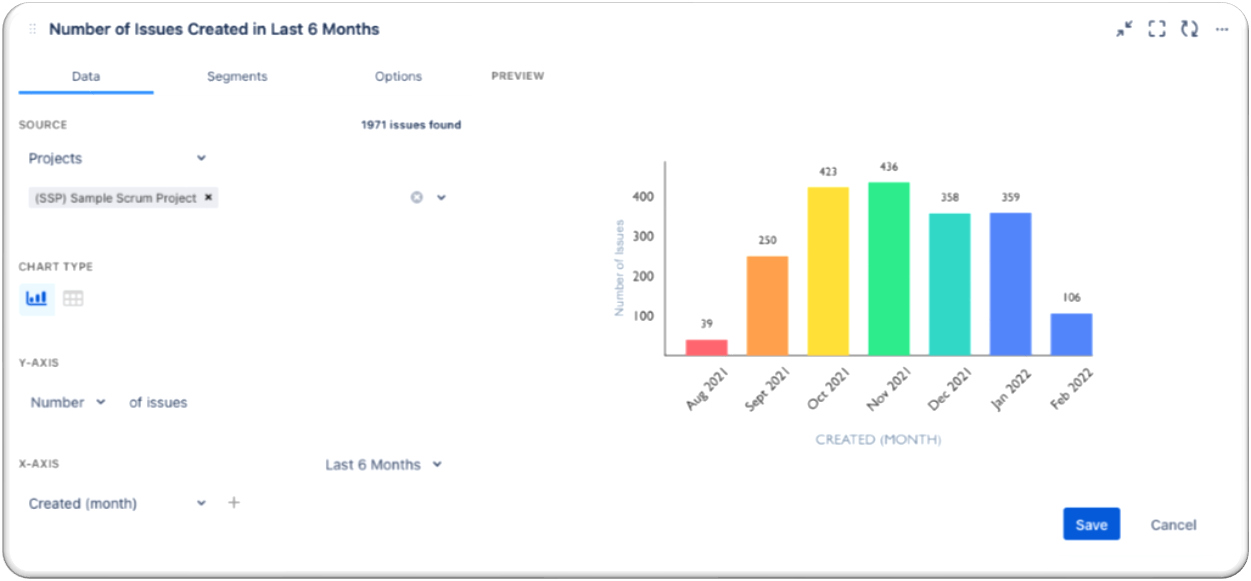
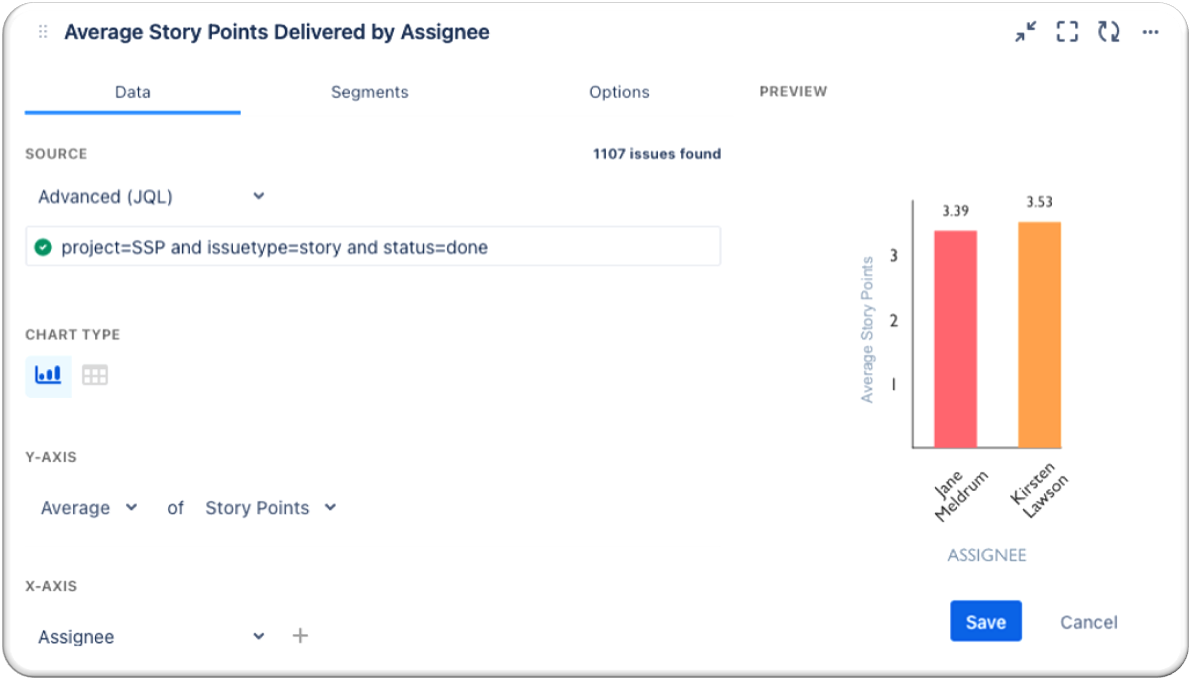
Configurable X Axis, Y Axis(Number, Sum, Average)
You are the creator of the reports and you have all the control over your reports. You just imagine and decide what to see as output and choose the parameters and set the fields accordingly. The rest is done by the app.
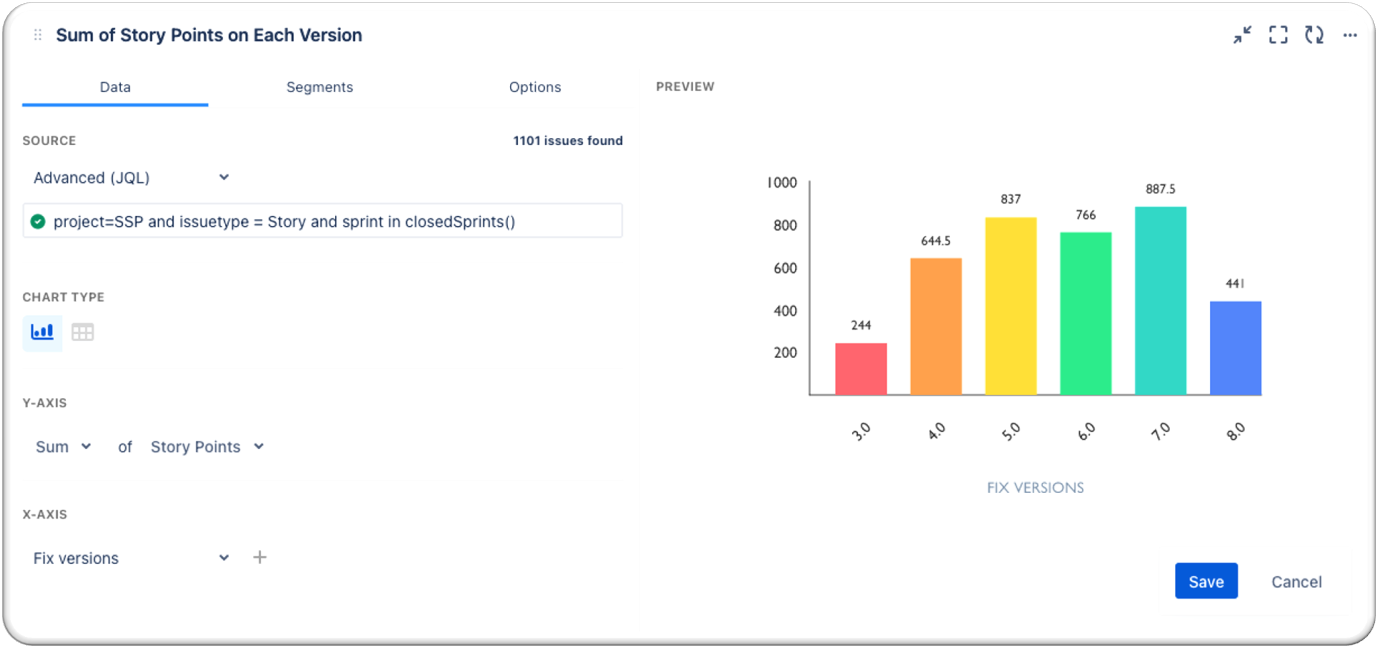
You can set X axis to be any parameter like Created(month), Assignee, Sprint, Fix Versions etc.
You can set Y axis to be any parameter like Number of Issues, Sum of Remaining Estimates, Average of Story Points etc.
The app provides user friendly, easily understandable and colorful views.
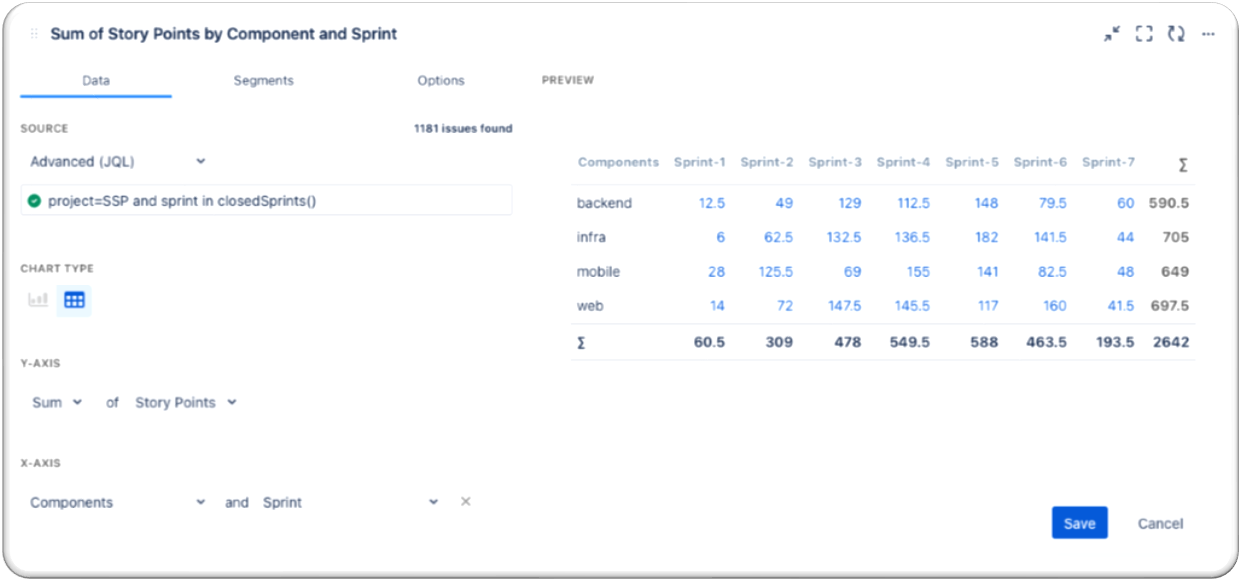
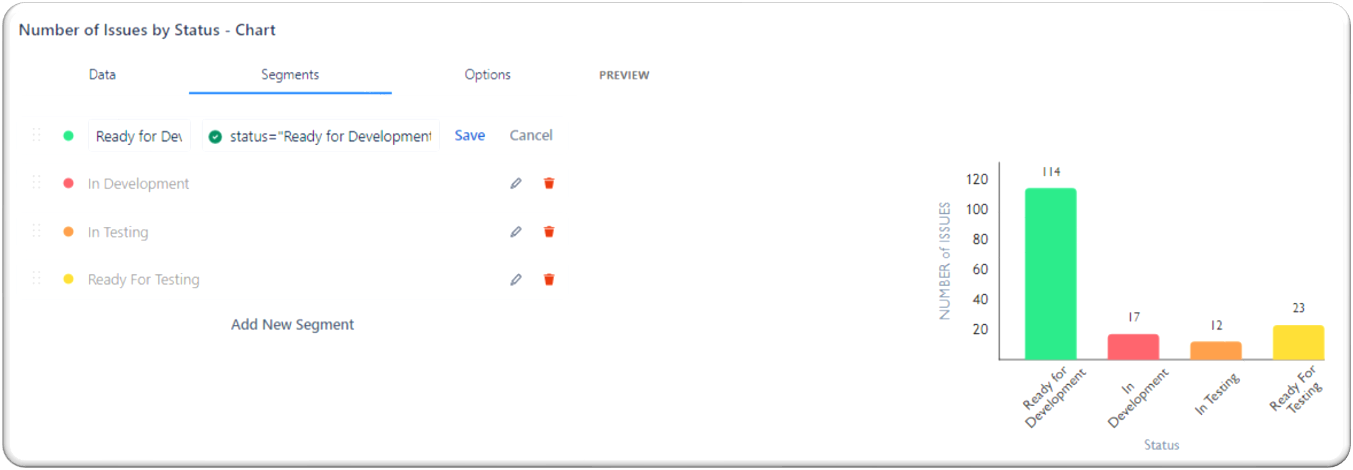
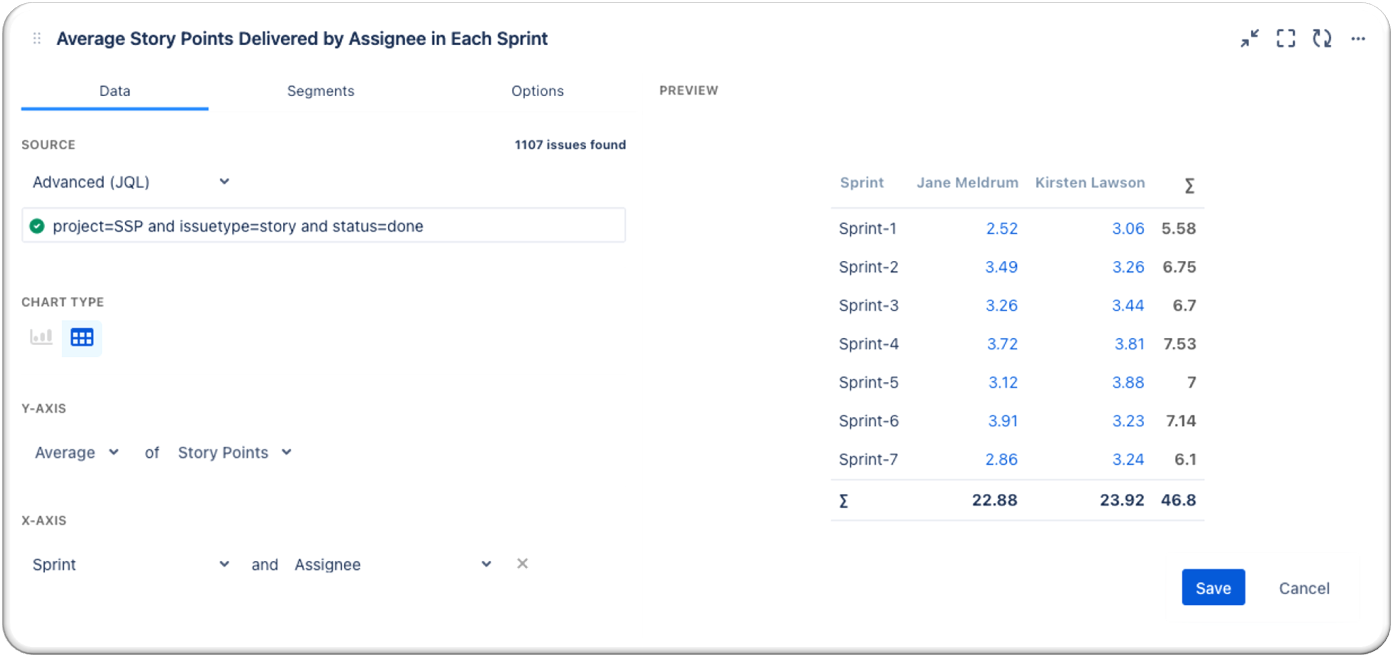
Grouping on Different Fields
You may need to create complicated reports as well as the simple ones and grouping data may be what you need to get the ultimate result. This app enables you group your data on any field(Sprint, Status, Assignee, Component, Project etc.) you want.
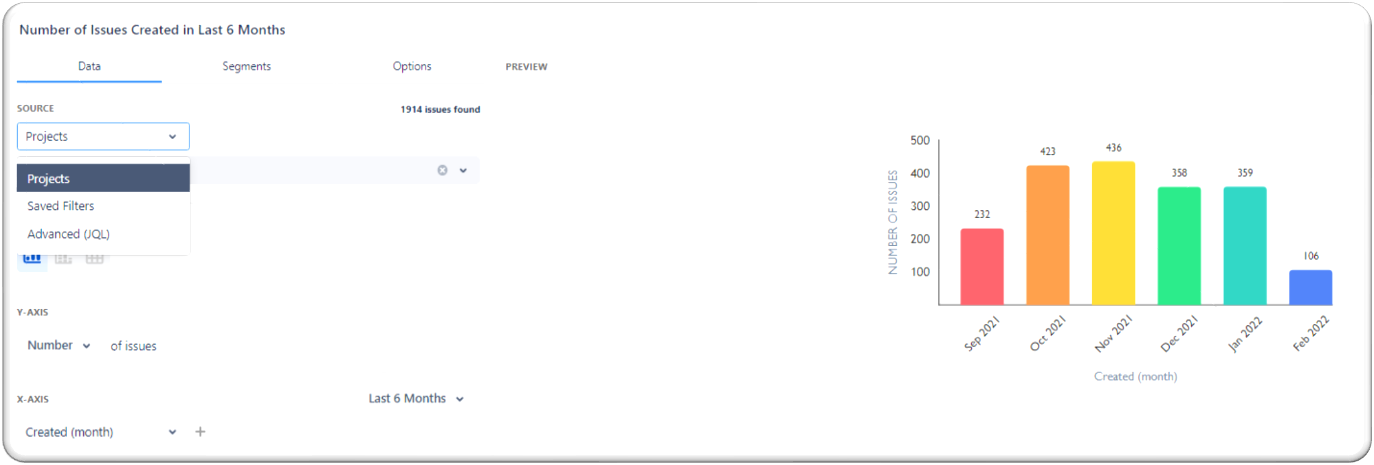
Various Data Sources
You can choose Projects or Saved Filters or Advanced (JQL) as your data source.
Various Date Ranging
You can setup date ranges for your reports and generate reports for date ranges like All Time, Last Year, Last 3 Months, Last 6 Months etc.
Easy Ordering
You may need to order the segments of your report and you can do it easily by drag and drop.
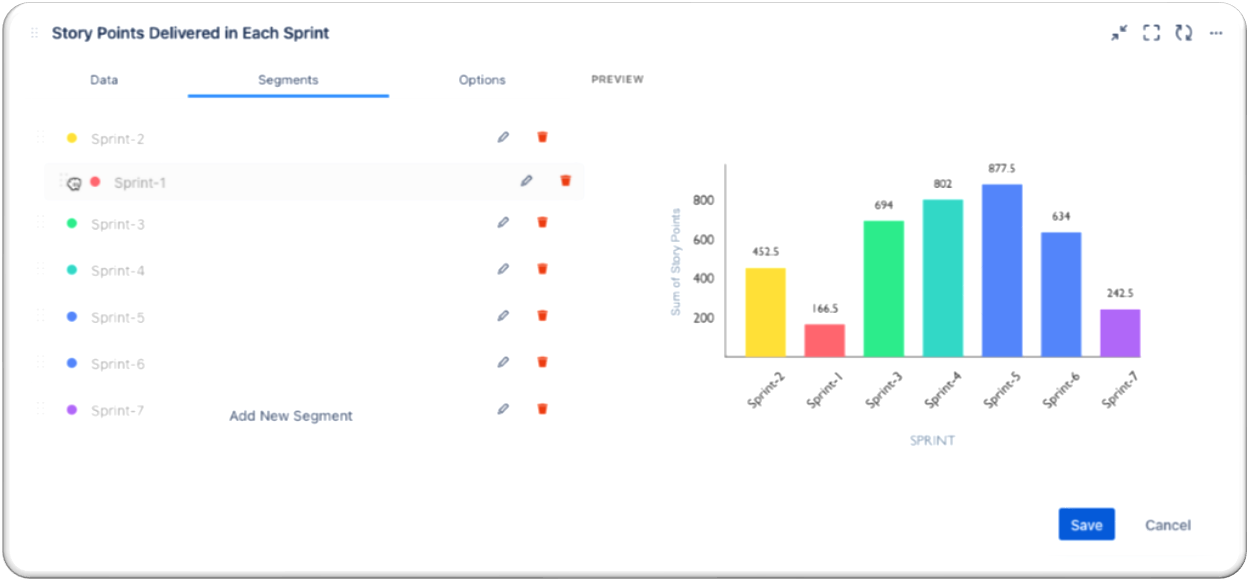
Modifying Segments
You can modify existing segments(Label and JQL), combine multiple segments into one segment or add new segment.
Sample Reports
Here are some sample reports that you can create with Reports - Charts and Graphs for Jira app.
If you need help or want to ask questions, please contact us through our Service Management or via email to support@bloompeak.io.